This is a summary of “How to Measure” in DevEx: What Actually Drives Productivity
Use both perceptual and systemic measurements
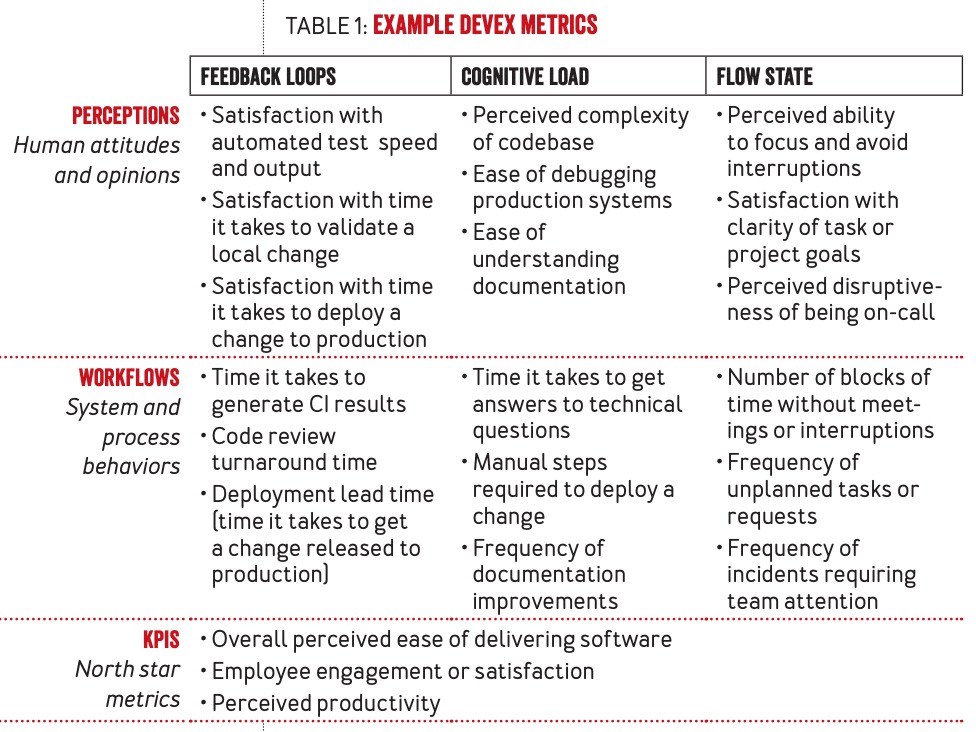
Perceptual metrics are self-reported and describe how developers feel (see why it’s important above in DevEx is both about tools and perceptions). They measure human attitudes and opinion.
Workflows measure systems and processes (e.g. the time it takes to build build targets).
You need both to understand the DevEx. For example:
- You might have quick code reviews that feel disruptive because they’re pushed invasively to developers
- Developers may feel satisfied with build processes but a measurement of build time may suggest that feedback loops could be quicker
Use surveys to measure perceptual data
Surveys are hard to design but allow you to collect data quickly and, when designed correctly, give accurate baselines.
When using surveys it’s important to:
- Break down results by team and persona because DevEx is highly contextual and varies dramatically by team and role
- E.g. if you focus on aggregate results you may overlook important problems for a subset of devs, like mobile devs
- Compare results against benchmarks
- Other teams/peers in the company
- Sentiment scores in other companies
- Mix in transactional surveys (what is this?)
- Try to consult with survey development experts
Example metrics
This is a generic proposal of metrics most companies could collect to measure DevEx based on the above and Google’s model to measure development productivity (speed, ease, quality).
Speed
| Metric | Measurement | Type |
|---|---|---|
| Build time | Time in seconds for a target to complete (P50 and P90) for both local and remote execution | Workflows |
| Post-commit CI | Time taken in minutes for each commit to get through the CI pipeline (P50/P90) | Workflows |
| Revisions that fail to land | Number of approved revisions that fail to land | Workflows |
Ease
| Metric | Measurement | Type |
|---|---|---|
| Onboarding | Business hours to 1st and 10th PR for all new hires (P50/P90) | Workflows |
| DevSat score | Satisfaction of working as a developer | Perceptual |
| Ease of code commit | Self-reported ease of committing code | Perceptual |
| Ease of code review | Self-reported ease of reviewing code | Perceptual |
| Perceived productivity | Self-reported productivity | Peceptual |
| Tool discoverability | % of engineers using a tool in the last month | Workflows |
| Runbook quality | Self-reported perception of the quality of a runbook | Perceptual |
| Information discovereability | Self-reported perception of the ease to find information a dev needs | Perceptual |
Quality
| Metric | Measurement | Type |
|---|---|---|
| Test determinism | % likelihood that a test suite does not flake | Workflows |
| Change Failure rate | Number of bugs per minor and patch release | Workflows |
| Change Failure rate | Number of post-merge failures per deployment | Workflows |
| Change failure rate | Number of P0s per deployment | Workflows |
| Time to resolve an incident | P50 and P90 of the number of business days taken to close an incident | Workflows |
| Size of PRs | P50 and P90 of PR size | Workflows |
| Freshness of dependencies | % of dependencies that are in its latest version | Workflows |
| Freshness of dependencies | P50 and P90 of the last time that a dependency was upgraded | Workflows |
| Freshness of documentation pages | % of unarchived documentation pages that have been edited in the last 6 months | Workflows |
| Freshness of runbooks | % of runbooks that have been edited in 6 months | Workflows |
| Testing | % of diffs that land with at least some tests | Workflows |
| Code health | Perceived code health | Perceptual |